Turning Log File Data Into Actionable Metrics
A common practice for many development organizations, including ours, is to collect logs and data during automated testing. Whether this is done to provide context for failures or as secondary quality measurements, ancillary data can be a vital part of any Continuous Integration (CI) process. The challenge is how to collect and use the data efficiently and effectively, one that doesn’t include the manual triage and dissemination of data after each run.

Testspace Custom Metrics provides a simple approach to do just that; to collect and mine data into actionable metrics.
Based on your data, Custom Metrics – in many ways similar to standard metrics such as test cases, code coverage, and static analysis – are whatever’s important to you and your organization.
A few examples include:
- Resource consumption - of memory, storage, peripherals, etc.
- Timing information - such as latency, delays, and duration.
- Measurements and counts - like attempts, retries, and completions.
Metrics can be informational or used as criteria for health; a binary pass|fail indicator for the current set of published results.
The following cases illustrate simple examples of custom metrics in use.
Resource Utilization during Continuous Integration
Consider the following text file with usage values (high watermarks) produced during testing.
Resource Management Data

CPU - Max Utilization (%)
   CPU 0 . . . . . . : 87
   CPU 1 . . . . . . : 22
   CPU 2 . . . . . . : 17
   CPU 3 . . . . . . : 29

Memory - Max Utilization (%)
   Physical  . . . . : 55
   Cache . . . . . . : 28
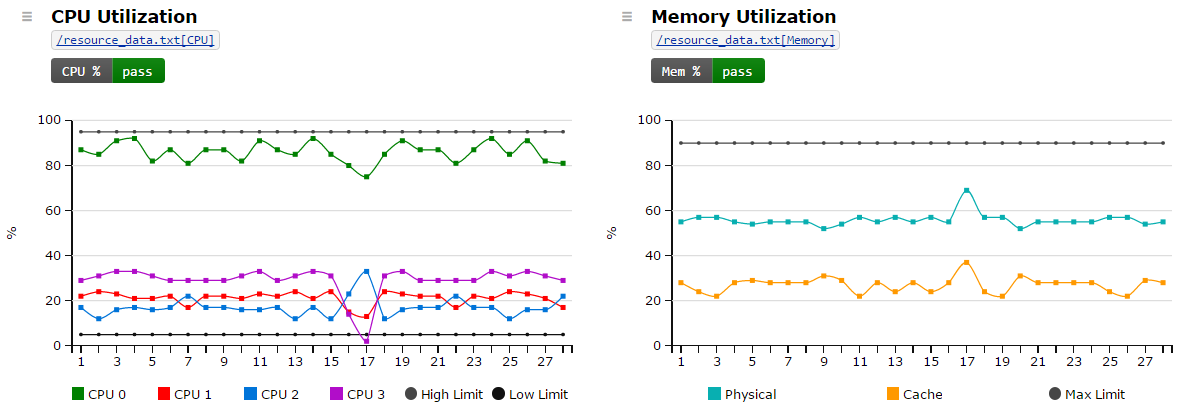
Let’s assume that it’s important for each CPU’s utilization to stay within a specific range. A value outside this range is an indication of incorrect (and perhaps harmful) software behavior, even if the tests are passing.
There are just two steps required: (1) add the values to a .csv file and (2) use the Testspace client to push the files to the Testspace Server along with the test results.
testspace test_results.xml resource_data.txt{resource_data.csv}
Once you push the first set of files, metric charts are automatically added to track and monitor the data over time. Expressions with variables, operators, and functions can be used to process the data. Thresholds based on your criteria can be used to determine if the metric is behaving as expected.
The charts below show an example where the utilization of one CPU fell below the threshold (see 17). The failed criteria would have triggered a notification at the time.

Peak Memory Consumption During Automated Testing
Another example is charting peak memory consumption from multiple pools of different size blocks
pool . . . . size/block . . max used
------------------------------------
small  . . .  128 bytes . . . 17
medium . . .  512 bytes . . . 12
large  . . . 1024 bytes . . . 7
x-large  . . 2048 bytes . . . 2
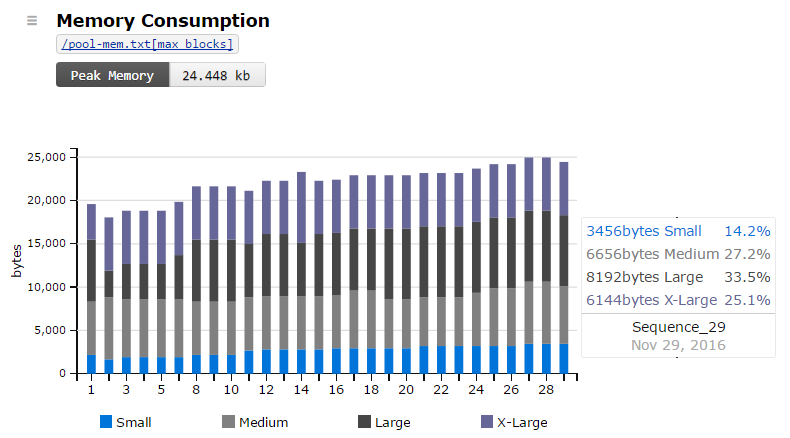
The Stacked Columns graph is well suited for combining and comparing aggregate data. By defining a simple formula for the metric, each entry in the column is calculated as the block size multiplied by the maximum number used. The total consumption, as displayed on the metric badge Peak Memory is defined as the sum of all pools.
The chart below provides a clear view of how memory consumption has grown over time.

Informational metrics like the above can help to manage and optimize valuable software resources over time.
Performance Metrics from Automated Testing.
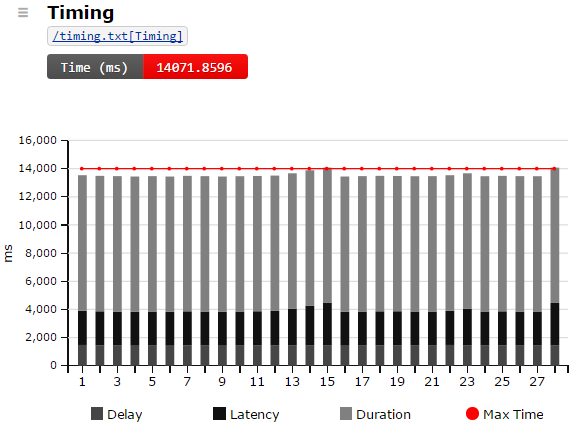
The 3rd example looks at timing data as shown in the file below. Let’s assume that the combined time must remain within some threshold. Anything beyond the threshold could lead to intermittent problems, or perhaps even the loss of competitive advantage.
Timing Measurements in "clock ticks."
   Delay . . . . 1457 (time to schedule task)
   Latency . . . 2391 (time from scheduling to execution)
   Duration  . . 9490 (time during execution)
From the badge, we can see that the metric has failed and that the total time displayed has exceeded the threshold. From the chart, it’s easy to see the cause was because of an increase in latency.

Get setup in minutes!
Try Testspace risk-free. No credit card is required.
Have questions? Contact us.