
Managing Software Quality with Testspace
A common reason why software companies struggle to maintain success is they’re unprepared for the inevitable growth in their software’s complexity and surface area. This inescapable increase in liabilities coincides with the thinning of budgets and headcounts as companies take on additional projects. Processes, sufficient during company and software infancy, collapse under the weight of the growing trend.

Companies that deploy Continuous Integration learn to manage growth in the software’s surface area – source files, versions, configurations, branches, languages…
Many companies, however, still fail to address the ever increasing complexity, merely because no single tool or process is sufficient in finding their software defects.
It stands to reason that by collecting as many indications of software health as possible, that we can minimize the chance of defects making their way into production environments.
Indications based on data from:
- Code Changes - information from commits and check-ins that trigger builds.
- Build Results - logs from assemblers, compilers, and linkers listing warnings and errors.
- Static Code Analysis - issues reported from specialized source analysis tools.
- Test Results - from all tests, often across multiple languages and frameworks.
- Code Coverage Measurements - from specialized coverage tools.
- Custom Metrics - from log files with any number of critical values produced during dynamic testing (performance numbers, watermarks, resource consumption, and more).
Each test tool, each form of verification, and each meaningful metric is just one piece in solving the multifaceted challenge of delivering quality software.
With the abundance of inexpensive and open source tools, test frameworks, hosted repositories, and CI/CD platforms, managing software quality has never been easier.
Testspace brings everything together
Aggregation of Test Measurements into a Single Record of Software Health
By pushing data, using a simple client (Windows, Linux, and macOS supported), the process of aggregation is a simple addition to any CI automation.
testspace results*.xml static-analysis.xml code-coverage.xml
All measurements, from all sources, are combined into a single, hierarchical record of health.
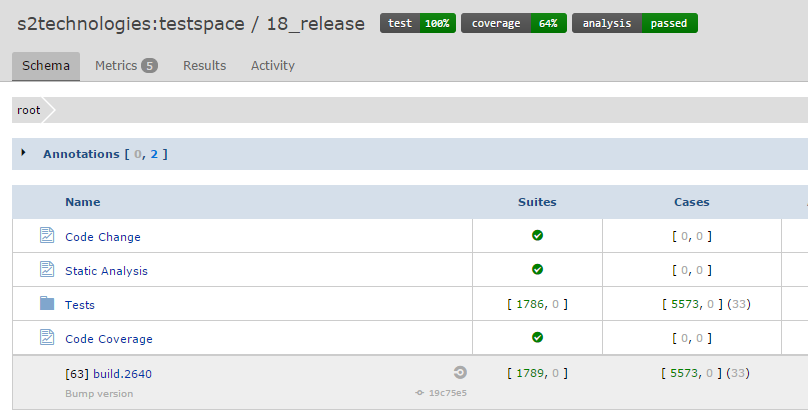
The Binary Indication of Software Health
By using arithmetic and logical formulas to define thresholds and criteria, Testspace allows decision makers and managers to define what it means for a software build to be deemed healthy.
Binary Indicators allow for quick and informed decision making without the need for a committee

The live links can be placed on any number of sites, that receive attention, and provide quick access to well-organized details, just when they’re needed most.

Any regression from any measurement fails the application’s health and triggers a notification to all subscribers; essentially, aggregating all measurements into a single, binary indication of health for every software build.
Test Results
In today’s software industry, there’s an abundance of commercial and open source test frameworks available to perform all kinds of software testing. Increasing the breadth and types of testing is an effective trategy to help deal with growth in complexity.
The following table highlights some of the Test Frameworks that Testspace supports.
| Language | Tools |
|---|---|
| C/C++ | Google Test Cpputest MS Unit Test Framework Catch |
| C# | NUnit MS Unit Test Framework xUnit.net |
| Java | JUnit TestNG |
| JavaScript | Jasmine Mocha QUnit |
| PHP | PHPUnit |
| Python | unittest PyTest |
| Ruby | Minitest RSpec |
Please refer to our Testspace Samples for examples from some of the tools above.
One considerable challenge with collecting lots of test results is maintaining a 100% pass rate on every commit. There are times when dependencies or competing priorities delay the resolution of failures. Please refer to our article on “Managing Test Failures Under Continuous Integration” to see how using Test Exemptions in Testspace can help.
Including Test Results in the Binary Measurement of Health
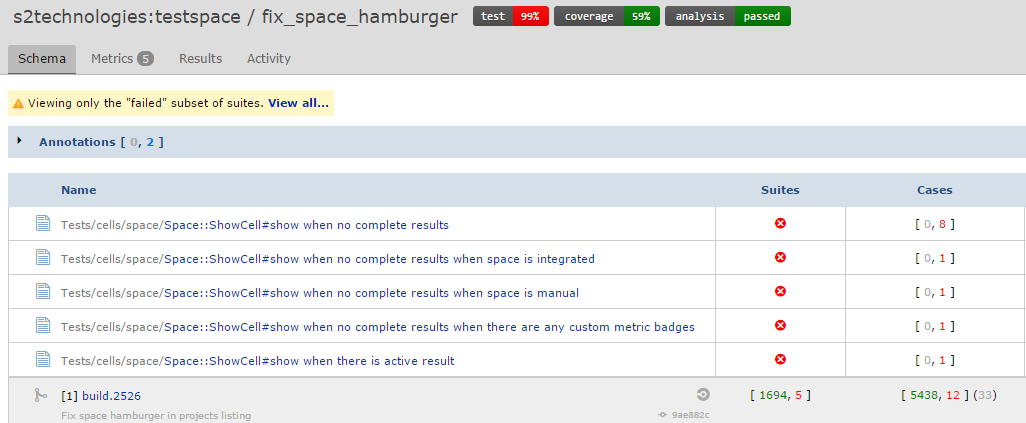
Test results, typically the primary source of verification, are included automatically in the application’s measurement of health.
The live test badge, wherever placed, provides quick navigation to test folders, suites, and cases – based on the test hierarchy defined in the result file(s).
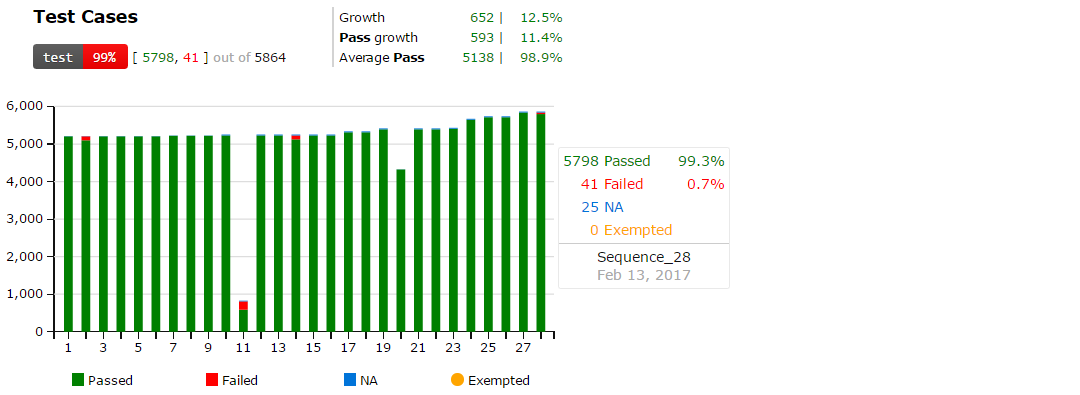
Trends and Insights from Collecting Test Results
The trending of test results provides meaningful insights into:
- whether test assets are catching regressions?
- whether test portfolios are growing?
- how quickly are regressions resolved?
Static Analysis
Static Code Analysis (SA) is the inspection of source code to aid in the prevention of runtime errors. SA tools can enforce consistency and accuracy to a particular set of rules. In today’s world of software connectivity, detecting security vulnerabilities (using rules) can be a matter of company survival.
There are a significant number of Static Analysis tools available, depending on the language(s) of the source code under test. Testspace can collect data from the vast majority, including:
| Language | Tools |
|---|---|
| C/C++ | Cppcheck CPPLint Klocwork OCLint PC-lint Vera++ Visual Studio PREfast |
| C# | Visual Studio FxCop |
| Java | Andriod Lint Checkstyle PMD |
| JavaScript | JSHint ESLint |
| PHP | PHP_CodeSniffer PHPMD |
| Python | flake8 pycodestyle PyLint |
| Ruby | Brakemen Rails-Best-Practices Reek Rubocop |
Please refer to our Testspace Samples for examples from some of the tools above.
Including Static Analysis in the Binary Measurement of Health
Static Analysis tools have a propensity to report false negatives, and immaterial issues, simply because of the statistical nature of the analysis methods used. Managing static analysis can become a costly component of your software development process, primarily from the complexity and sheer quantity of potential issues identified. The act of managing SA issues is a process that has yet to be automated.
Q: What’s the most effective approach to maximizing the value of static analysis while minimizing time and effort?
A: To amortize the costs, continuously, across the entire development team so that the individual requirements for a single developer become negligible over time.
Requiring developers to search for results to manually check for new issues and regressions is an ineffective use of highly skilled and highly paid resources.
Deploying a specialized team to manage SA issues and chase down developers for resolution adds inefficiency and delay to the software process.
Most SA tools provide a means to prioritize software issues by severity. In all cases, committing new, high-severity issues should be considered a regression of health.
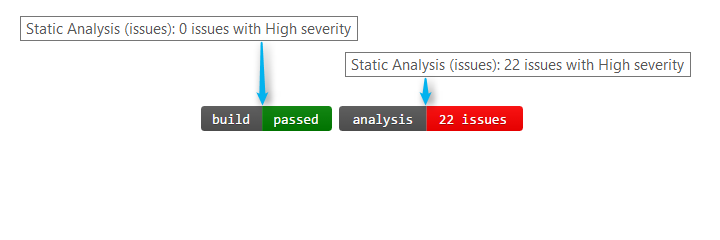
The image below shows two Testspace badges with their tooltips used for tracking SA results for a single branch. The first showing results from the build tools, the second from a specialized source code analyzer. The later showing a regression as the number and category of issues found exceeded the criteria set for the metric.
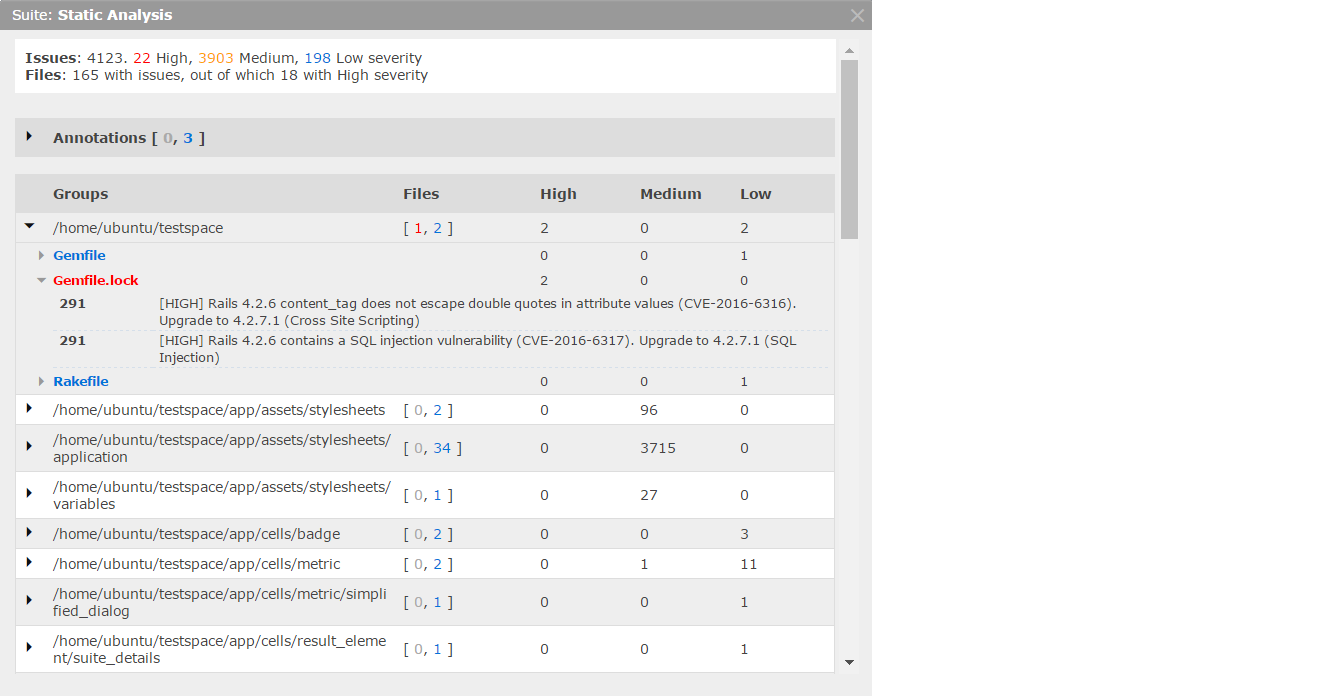
The live links provide quick access to actionable details. The image below illustrates the publishing of SA issues grouped by source folder.
Trends and Insights from Including Static Analysis
Just as important as the actual numbers are the insights we gain from the historical trends.
The following chart shows static analysis data collected from a series of commits to a short-lived feature branch.
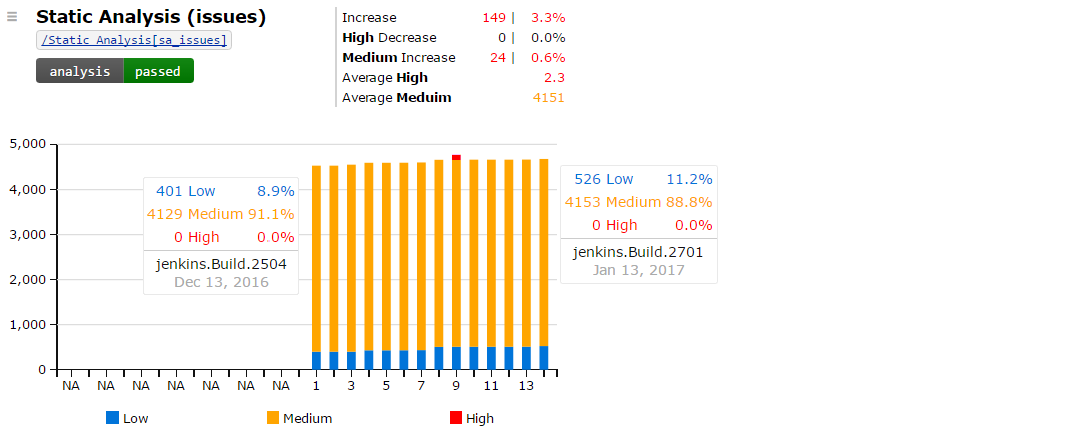
The trend shows a clear and gradual increase of mostly Low severity issues. It also illustrates that when a health regression occurred (new high priority issues), it was identified, notified, and quickly resolved; showing an effectiveness of criteria and efficiency of process.
Code Coverage
Code Coverage, often referred to as test-coverage, measures the degree to which code was executed for a given set of tests. Coverage measurements are collected through a process of source code instrumentation applied by specialized tools.
Code Coverage is not a measurement of correctness. One could surmise, however, that software deployed with a low level of coverage – as compared to a high level – is far more likely to contain runtime errors. What coverage analysis does exceptionally well is identifying source code that has gone untested.
Methods of Code Coverage Analysis
There are a variety of methods used to analyze and report code coverage, including:
- Line or Statement coverage - identifies the lines of code executed.
- Branch coverage - identifies the code branches executed, including multiple branches per line.
- Block coverage - identifies the sequences of non-branching statements executed.
- Function and Method coverage - identifies each function or method called at least once.
- Condition coverage - identifies which true and false paths are covered for each boolean statement.
- Decision coverage - often paired with condition coverage, identifies the outcomes executed for each decision statement in the code.
The type(s) of analysis and reporting available depends on the tools available for the software language(s) used in the application under test.
Testspace supports all the above methods utilized by the vast majority of commercial and open source coverage tools available, including:
| Language | Tools |
|---|---|
| C/C++ | Gcov Bullseye OpenCppCoverage Visual Studio Coverage |
| C# | dotCover OpenCover VisualStudio |
| Java | Cobertura Clover JaCoCo |
| JavaScript | Istanbul JScover |
| PHP | PHPUnit |
| Python | Coverage.py, |
| Ruby | SimpleCov |
Please refer to our Testspace Samples for examples from some of the tools above.
Including Code Coverage in the Binary Measurement of Health
Increasing test coverage, more than a couple of percentage points, can require a concerted effort – even as much as a company initiative – all coming at the cost of other development opportunities.
Increased coverage can be hard fought battle, and new ground should be held once acquired.
On a main or master branch, enforcing a minimum level – a threshold just below the current level of coverage – can ensure coverage of new features before emerging from their individual development or feature branch. In all cases, a significant drop in coverage should be considered a regression of health and should be notified as such.
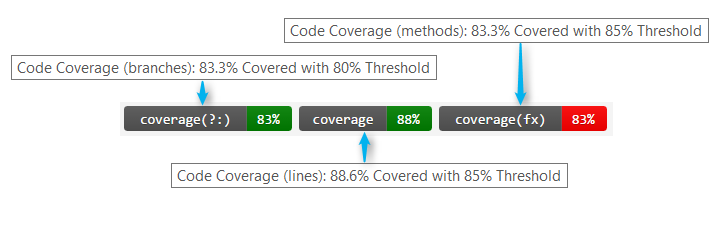
The image below shows 3 Testpsace metric badges with their mouse-overs tracking three types of coverage analysis. All three are for a single software branch connected to CI. The third badge shows a regression of function coverage as the level has fallen below the threshold set for the metric.
The live links provide quick access to actionable details as shown below
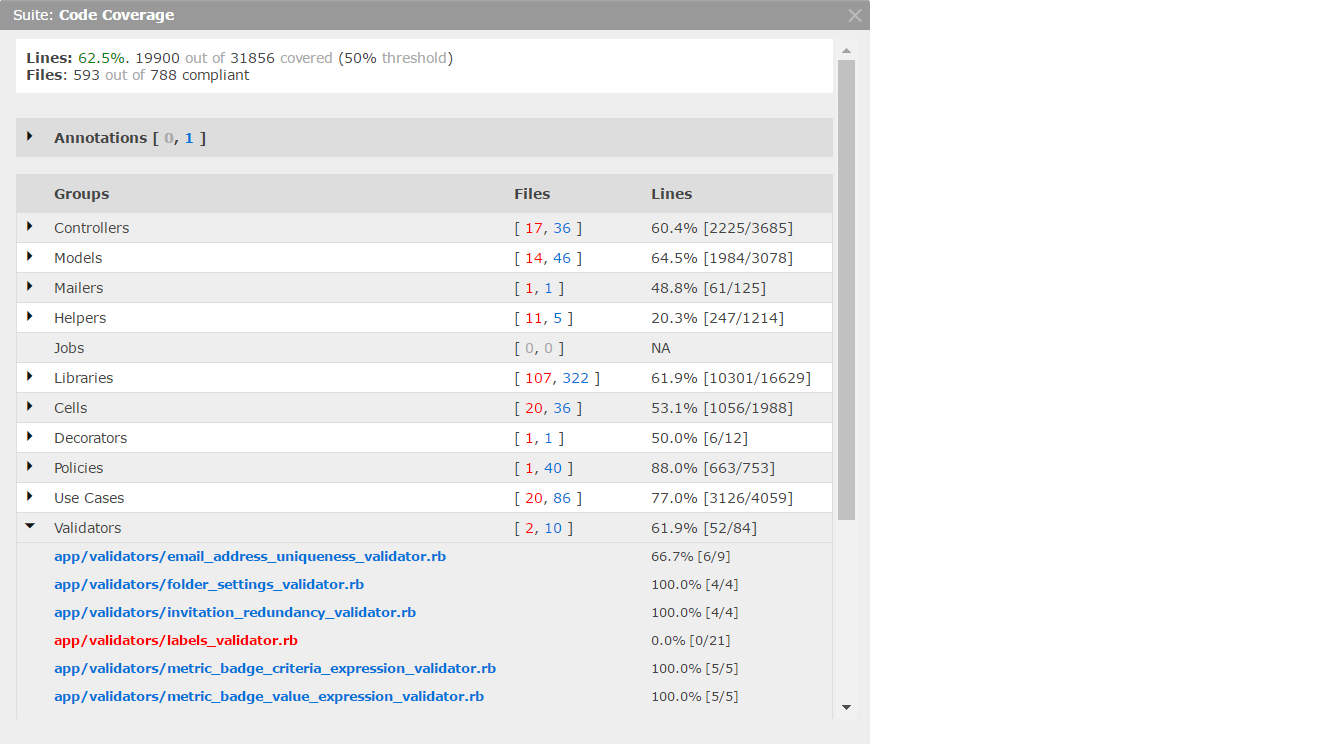
The above image shows the packaging of coverage results for 788 ruby files organized by group.
Trends and Insights from Including Code Coverage
Just as important as the actual coverage numbers are the insights we gain from the historical trends.
The following chart shows coverage data collected from a series of commits to a short-lived feature branch.
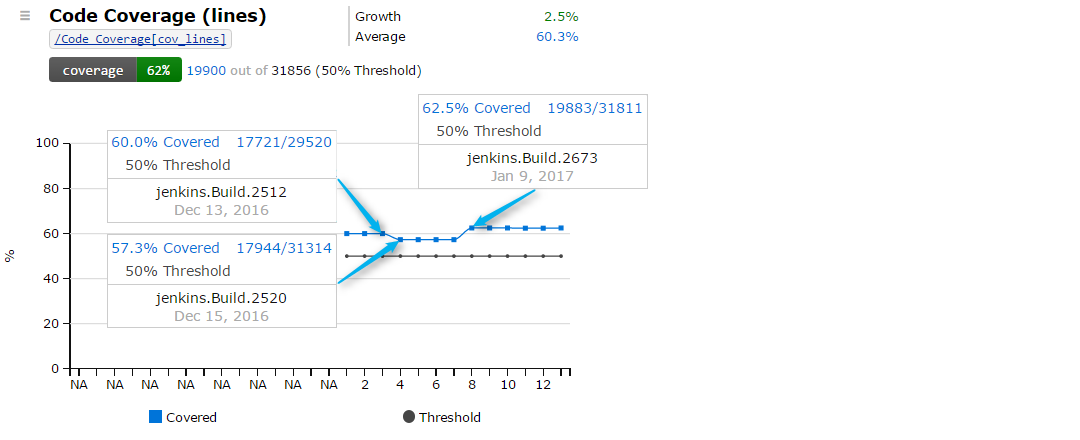
One might argue that ~60% coverage seems a little low. The trend, however, illustrates an efficient and effective workflow.
Custom Metrics
One of the key features that Testspace provides is a very simple way of adding custom metrics to the calculation of health. Timing, performance, stability, throughput, any measurement that’s important in determining the overall health of the application under test.
Using custom metrics, software teams expand their testing to include other dimensions of verification important to ensuring software quality before delivery.
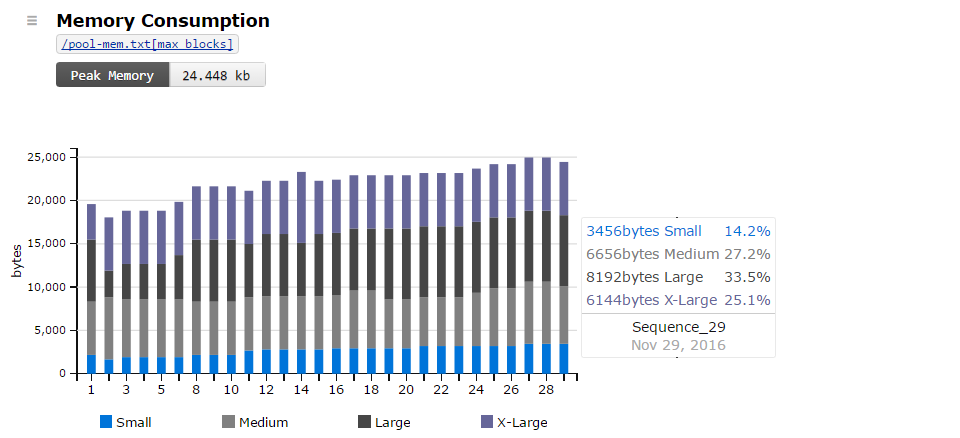
Please refer to our article on “Turning Log File Data Into Actionable Metrics” to see how to setup metrics just like the Memory Consumption trend shown below.
Get setup in minutes!
Try Testspace risk-free. No credit card is required.
Have questions? Contact us.